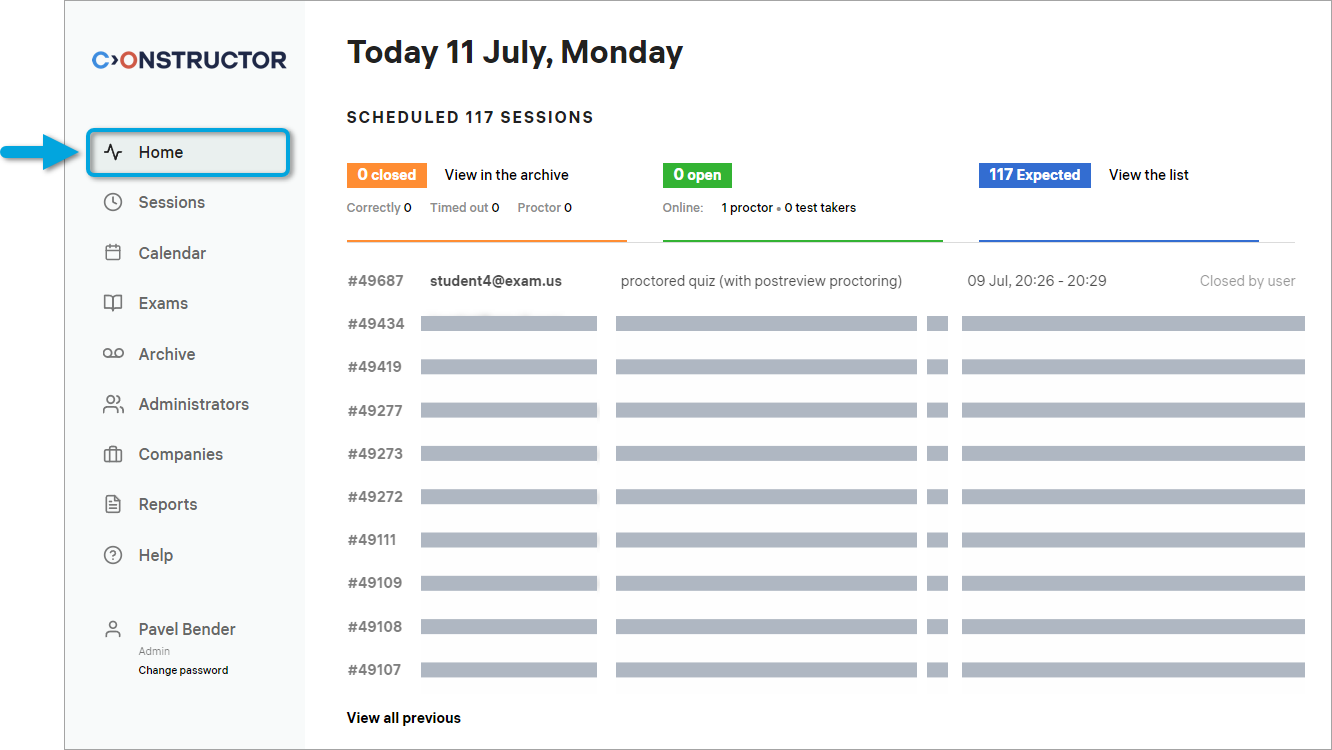
Viewing dashboard home page
After successfully signing in, you will land on the Home tab:
At the top of the screen, the following counters are displayed:
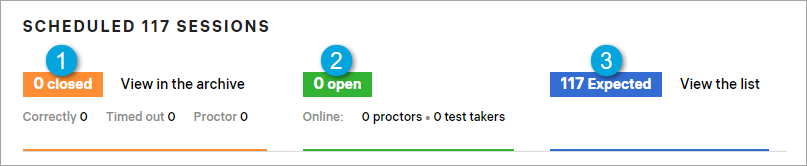
According to the numbers in the screenshot, each counter represents a number of exam sessions that were:
- 1 — closed today.
- 2 — are currently open.
- 3 — are scheduled for the future.
In the middle of the screen, the 10 most recent exam sessions are displayed:
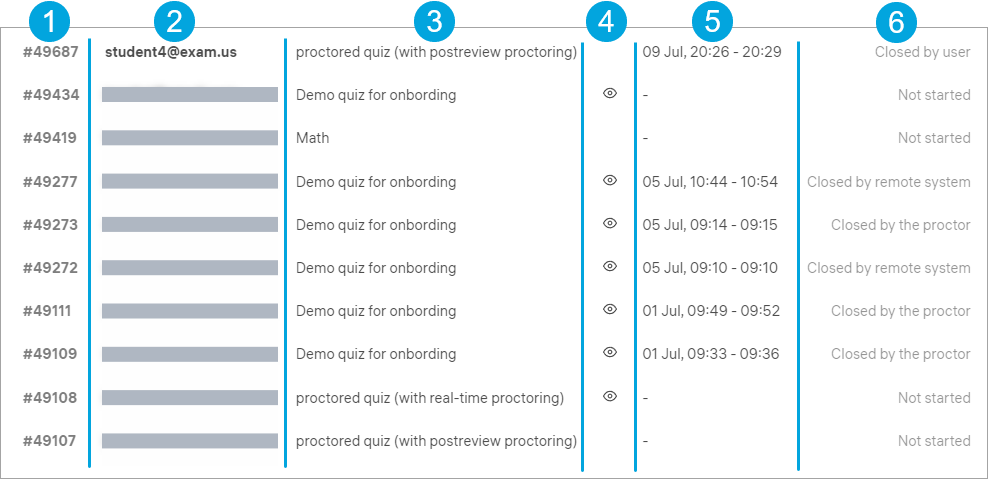
According to the numbers in the screenshot, the columns represent the following:
- 1 — a session number.
- 2 — the email address of the participating examinee.
- 3 — the exam name.
- 4 — the type of proctoring used in the exam (the eye icon means live review, no icon means post-exam review).
- 5 — the date of the session and its duration.
- 6 — the session status.
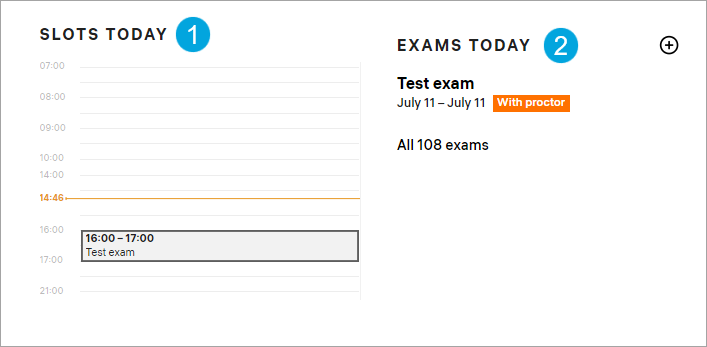
Scroll the Home page down to see:
- 1 — proctoring slots created for today’s exam sessions.
- 2 — a list of exams scheduled for today.
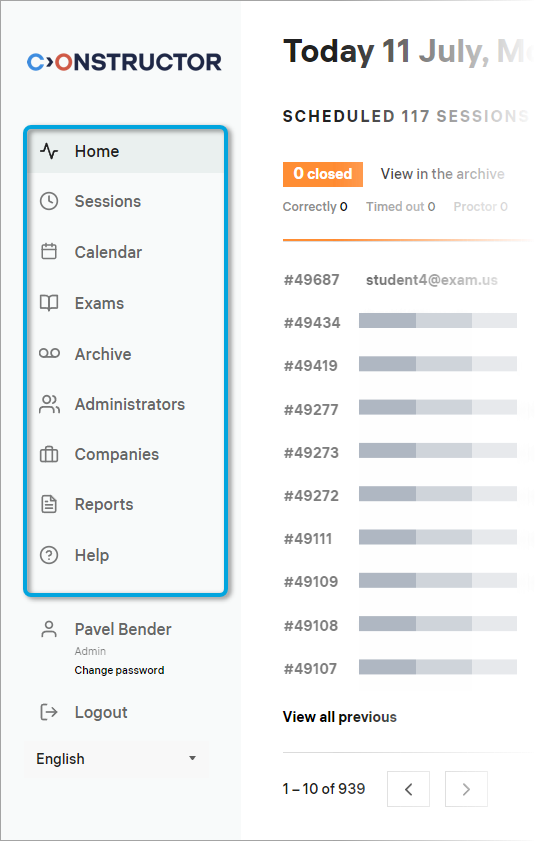
On the left, there’s a sidebar that lets you access various functions of the admin portal:
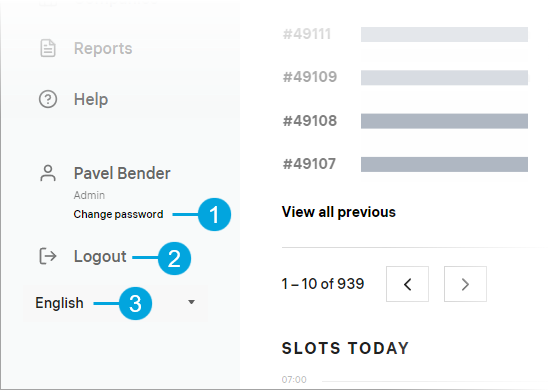
Below the sidebar are a few controls that let you change your password (1), log out from the admin portal (2), and change the language in which the portal is displayed (3):
Now we’ll take a look at each of the tabs located in the sidebar starting from Sessions.